Tutorial: Simulating your circuit on QUCS and using an Arduino as an Oscilloscope
I'm sure you're thinking that the tutorial sounds like a mouthful but worry not, because this is going to be as easy as stubbing your toe against your furniture in pitch darkness. Albeit, with less pain! 😉
Now I'm sure that most seasoned Arduino hobbyists have heard that it's possible to use your Arduino to make an Oscilloscope. Oscilloscopes tend to be very expensive so this is exciting because in your journey as a hobbyist, there are bound to be times where you will be in need of an Oscilloscope.
There are several (far more accurate) ways of building a circuit and running a software to create an oscilloscope display with an Arduino. In this tutorial, I will focus on a very basic and simple method of obtaining an oscilloscope display. Unfortunately, it's likely not to be accurate as frequency can be a limiting factor, and the initial waveforms are not captured as well. Still, I believe you will find it useful for simple circuits.
In order to verify that the oscilloscope is displaying a waveform similar to a circuit's theoretical output, we need to simulate the circuit in a software first. Now there several softwares which serve that purpose, e.g Proteus (though it's a commercial one). Just a simple Google search will give you a list of free circuit simulation softwares. In this tutorial, I'm using QUCS which stands for Quite Universal Circuit Simulator! (Not gonna lie, that is an amazing name for a software! 😂)
To demonstrate, I'm going to build a circuit which transforms a square wave to a triangular wave to a graph that gradually increases and stabilizes. (Though there are better ways of creating a similar circuit, for simplicity's sake, I'm going to stick with the one shown in this tutorial).
The final circuit that we want to obtain is shown below:

Open the software, and drag components from the lumped components list.


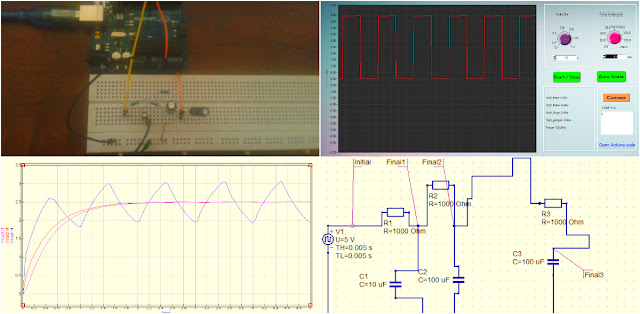
The resulting output was this:
 Overall, with all three datasets this is what the output is supposed to look like. Also, a table can give you the numerical data. We are going to cross check the waveforms and numerical data against our Oscilloscope display.


The input wave looks like this on the oscilloscope.

The output at the first capacitor junction looks like this. You can observe that it's a triangular wave and the voltage output is around 3 V which matches our simulation result.


Now I'm sure that most seasoned Arduino hobbyists have heard that it's possible to use your Arduino to make an Oscilloscope. Oscilloscopes tend to be very expensive so this is exciting because in your journey as a hobbyist, there are bound to be times where you will be in need of an Oscilloscope.
There are several (far more accurate) ways of building a circuit and running a software to create an oscilloscope display with an Arduino. In this tutorial, I will focus on a very basic and simple method of obtaining an oscilloscope display. Unfortunately, it's likely not to be accurate as frequency can be a limiting factor, and the initial waveforms are not captured as well. Still, I believe you will find it useful for simple circuits.
In order to verify that the oscilloscope is displaying a waveform similar to a circuit's theoretical output, we need to simulate the circuit in a software first. Now there several softwares which serve that purpose, e.g Proteus (though it's a commercial one). Just a simple Google search will give you a list of free circuit simulation softwares. In this tutorial, I'm using QUCS which stands for Quite Universal Circuit Simulator! (Not gonna lie, that is an amazing name for a software! 😂)
To demonstrate, I'm going to build a circuit which transforms a square wave to a triangular wave to a graph that gradually increases and stabilizes. (Though there are better ways of creating a similar circuit, for simplicity's sake, I'm going to stick with the one shown in this tutorial).
Step 1: Install QUCS
Just follow this link and download it, as per your operating system.Step 2: Creating a Circuit
The final circuit that we want to obtain is shown below:

Open the software, and drag components from the lumped components list.

To edit a component's resistance value, capacitance etc.. Right click on the component and press "Edit Properties", and change the value accordingly.
To connect two components together, press the wire icon the toolbar and connect the ends of the components.
Since we are supplying a square wave of 100 Hz, we need to go to the sources section in the Main Dock, and select " Rectangular Voltage". Set both TH and TL to 0.005 s. This means a high pulse and a low pulse last for 0.01 s, which corresponds to a frequency of 100 Hz. You can change the length of the pulses according to your needs.


Step 3: Simulating the Circuit
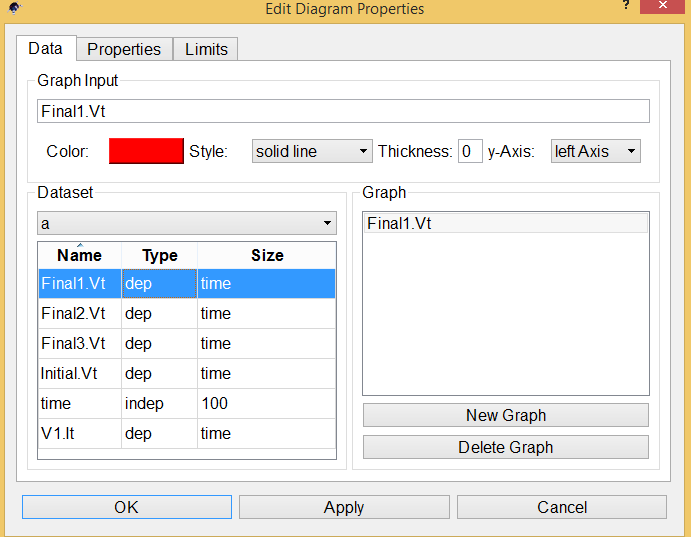
Select "Wire Label" on the toolbar and place it at the nodes where you want to measure the waveforms. In this circuit I've placed them at 3 different nodes, and named them Final 1, Final 2 and Final 3. Then in the Main Dock go to Simulations and select "Transient Simulation". You can add in the respective values shown below. Remember the higher the "Number" variable, the more time it takes to simulate your circuit.

Go to Simulation-> Press Simulate. It will ask you to save your file and may take a while.

Go the Main Dock and drag out the format in which you want your data to appear, in this case I'm going to drag Cartesian, which will give a graph of the waveform output. Select the Dataset you want to display, as shown below. You can choose to display several datasets at the same time.
The resulting output was this:


Step 4: Create your Circuit on a Breadboard
This is the resulting circuit that I made

Step 5: Download PC Scope and tweak the code
The software was written by a person named Balaji Ramalingam, and the following video gives a good summary on how to set it up.
Here is the download link for the software.
If you don't want to watch the video, just unzip the file, open the Arduino .ino file. Connect the wire from A0 ( the pin which acts as a probe), to the node which you want to observe. Connect Pin 8 (which creates a 100 Hz Square Wave) to your circuit and connect the Arduino's ground to your circuit's.
Copy the line below and include it in void loop().
tone(8,100);
Step 6: Open the PC Scope Software and compare the waveforms
The input wave looks like this on the oscilloscope.

The output at the first capacitor junction looks like this. You can observe that it's a triangular wave and the voltage output is around 3 V which matches our simulation result.

The second and third junction output values are around 2.5 V and the output for both is straight line. While the simulation wave forms fluctuate slightly, this is not captured by the oscilloscope.


To conclude, the oscilloscope can be of great use for simple circuits, where you want to verify the waveform outputs. Keep in mind that frequency can be a limiting factor, and you can't determine the exact value at any given point on the wave. However, one can conclude that QUCS is a really helpful software for circuit simulation and can be a great tool for learning all about electronic circuits.
Hopefully, this tutorial helped you guys out! Please let me know if you any queries.
For more information regarding QUCS and PCScope here are two sources below:


Comments
Post a Comment